Who This Is For
You are building a Python app on Ubuntu that calls the Claude API. Maybe it is a simple chat wrapper, maybe it is a multi-step agent that calls external tools. Either way, you want two things: confidence that the app is working, and visibility when it is not. This guide wires up the Anthropic Python SDK, adds Sentry for error tracking and performance monitoring, and covers the observability gaps that raw logs will never fill. All commands are Ubuntu-native.
Setting Up Your Ubuntu Environment
Before writing any Python, you need Node.js if you plan to use Claude Code (Anthropic’s terminal-based coding agent). Ubuntu’s default repositories do not include claude-code, so a plain sudo apt install claude-code will fail without first adding Anthropic’s signed APT repository. The fastest path is through Node.js and npm:
sudo apt update && sudo apt install npm nodejsOnce npm is available, Claude Code installs globally. Claude Code can authenticate with a Claude Pro, Max, Team, or Enterprise subscription, or it can bill against API usage through an Anthropic Console account. Pick whichever matches your setup.
For the Python side, create a virtual environment to keep dependencies clean:
python3 -m venv .venv
source .venv/bin/activate
pip install --upgrade anthropic sentry-sdk
The anthropic package on PyPI is Anthropic’s official typed Python client for the Claude REST API. It ships with synchronous and async/await usage, streaming (SSE) support, token counting utilities, tool-calling helpers, and built-in retry logic with error mapping. You are not rolling your own HTTP client here.
Getting an API Key
The Claude API requires an Anthropic Console account and an API key. Go to platform.claude.ai, create a project, and generate a key. Stop there. Do not paste that key into your source code
On Ubuntu:
export ANTHROPIC_API_KEY="sk-ant-..."
export SENTRY_DSN="https://..."
Add those to your shell profile (~/.bashrc or ~/.zshrc) or, for a project, drop them in a .env file and add .env to .gitignore before the first commit. For production workloads, prefer a secrets manager. The environment variable approach is the floor, not the ceiling.
Your First Claude API Call
With the SDK installed and the key exported, a minimal synchronous call looks like this:
import anthropic
import os

client = anthropic.Anthropic(api_key=os.environ["ANTHROPIC_API_KEY"])

message = client.messages.create(
 model="claude-opus-4-5",
 max_tokens=1024,
 messages=[
 {"role": "user", "content": "Summarize the Sentry docs in two sentences."}
 ]
)

print(message.content[0].text)
Claude’s large context windows (up to 200K tokens), native tool use, and extended thinking capabilities make it well-suited for complex multi-step agent workflows, but the API surface is intentionally simple. A single messages.create call is all you need for straightforward tasks. The SDK handles retries automatically if the API returns a transient error.
For async workloads, swap anthropic.Anthropic for anthropic.AsyncAnthropic and use await client.messages.create(...). The interface is otherwise identical.
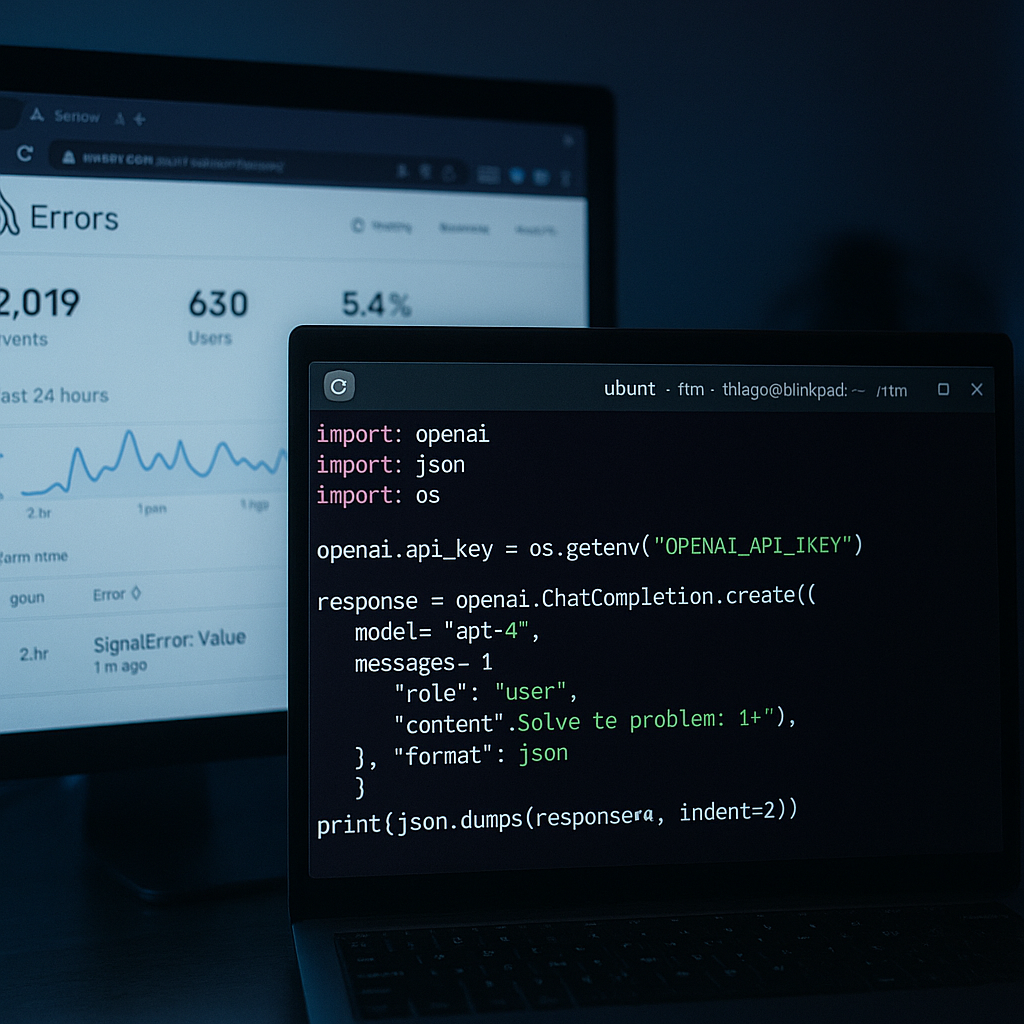
Adding Sentry: Error Tracking First
Sentry is an error tracking and performance monitoring platform. Getting it into a Python project is a two-step operation: install the SDK, then initialize it early in your application startup, before any other code runs.
import sentry_sdk
import os

sentry_sdk.init(
 dsn=os.environ["SENTRY_DSN"],
 traces_sample_rate=1.0,
)
traces_sample_rate=1.0 captures 100% of transactions. For a prototype or low-traffic service that is fine. For high-throughput production, you will tune this down, but read the AI monitoring section first before you do.
To confirm the integration is wired up before you go further, fire a test event:
import sentry_sdk
sentry_sdk.capture_message("Hello Sentry!")
That message will appear in your Sentry dashboard within seconds. If it does not, the DSN is wrong or the network is blocked. Fix it now, not after you deploy.
AI Agent Monitoring: Where Sentry Goes Beyond Logs
This is the part that changes how you think about instrumentation for AI apps.
When something breaks in an AI agent, traditional logs miss the full picture. A timeout, a tool that returns nothing, a model response that causes a downstream parse error: logs give you a timestamp and an exception. Sentry’s AI Agent Monitoring gives you the entire agent run. Prompts, model calls, tool spans, and errors, all linked to the user action that triggered them.
Sentry can automatically detect and configure monitoring for LLM calls, agents, and AI SDKs. It auto-detects installed AI packages, including Anthropic, and enables appropriate integrations with zero manual registration in Python. That means if you have already done sentry_sdk.init(...) with tracing enabled and anthropic is installed in the same environment, Sentry starts collecting AI spans automatically.
Sentry’s AI Agent Monitoring feature is currently in Beta (as of April 2026), but it is production-usable. The dashboard shows agent runs as OpenTelemetry gen_ai span hierarchies. You get searchable, filterable trace views with model info, tool execution spans, token usage (including cache metrics), and session tracking.
One non-obvious gotcha from the Sentry blog: “Agent runs are span hierarchies. Sampling drops complete executions, not individual calls. If tracesSampleRate is below 1.0, you’re losing entire agent runs. Use tracesSampler to keep AI routes at 100% while sampling everything else at baseline.”
In practice, that means something like this:
def traces_sampler(sampling_context):
 # Keep all AI agent transactions
 if "claude" in sampling_context.get("transaction_context", {}).get("name", ""):
 return 1.0
 # Sample everything else at 10%
 return 0.1

sentry_sdk.init(
 dsn=os.environ["SENTRY_DSN"],
 traces_sampler=traces_sampler,
)
If your app has multi-turn conversations, set a conversation ID so Sentry can group related AI spans. Sentry uses the gen_ai.conversation.id attribute to build the Conversations view in the dashboard. Without it, every message looks like an isolated event.
The PII Problem with Prompt Capture
Sentry can record the actual prompts your app sends to Claude and the model responses it receives. This is genuinely useful for debugging, but it is a PII risk that deserves explicit opt-in, not a default.
The Sentry documentation is direct: “Prompt and output recording captures user content that is likely PII. Before enabling include_prompts/send_default_pii, confirm the application’s privacy policy permits capturing user prompts and model responses, and that it complies with applicable regulations (GDPR, CCPA, etc.). Do not enable it by default.”
On Ubuntu in development you might enable it temporarily to inspect what the model is actually receiving:
sentry_sdk.init(
 dsn=os.environ["SENTRY_DSN"],
 traces_sample_rate=1.0,
 send_default_pii=True, # Development only. Review privacy policy before production.
)
In production, leave send_default_pii out entirely or set it to False. If you need prompt visibility in production for a specific debug session, enable it temporarily, capture what you need, then turn it off. Build that toggle into your deployment config, not your application code.
The Claude Code + Sentry Plugin Inner Loop
If you are using Claude Code on Ubuntu to write the app itself, the Sentry plugin for Claude Code closes the feedback loop in a useful way. The plugin brings error monitoring and debugging capabilities directly into Claude Code, providing access to error reports, stack trace analysis, and the ability to debug production errors without leaving the terminal.
The workflow looks like this: you write code with Claude Code, deploy it, Sentry captures an error, and then you ask Claude Code (with the Sentry plugin active) to analyze the stack trace and suggest a fix. The plugin provides real-time access to error data with severity indicators and user impact metrics, and it surfaces an issue-summarizer agent that can analyze multiple issues in parallel. The Sentry integration can send issues directly to Claude for automated root cause analysis and fix generation.
For Ubuntu developers already living in the terminal, this keeps the entire development loop in one place. You are not switching between a browser, an IDE, and a chat interface.
Putting It All Together
A complete, minimal app.py that connects all the pieces:
import anthropic
import sentry_sdk
import os

def traces_sampler(ctx):
 if "claude" in ctx.get("transaction_context", {}).get("name", ""):
 return 1.0
 return 0.1

sentry_sdk.init(
 dsn=os.environ["SENTRY_DSN"],
 traces_sampler=traces_sampler,
 # send_default_pii=False # default; set explicitly if you want to be clear
)

client = anthropic.Anthropic(api_key=os.environ["ANTHROPIC_API_KEY"])

with sentry_sdk.start_transaction(name="claude-chat", op="ai.agent"):
 try:
 message = client.messages.create(
 model="claude-opus-4-5",
 max_tokens=512,
 messages=[
 {"role": "user", "content": "What is observability in three sentences?"}
 ]
 )
 print(message.content[0].text)
 except anthropic.APIError as e:
 sentry_sdk.capture_exception(e)
 raise
Run it:
source .venv/bin/activate
python app.py
Check your Sentry dashboard. You should see a transaction with an AI span nested inside it, token usage recorded, and the model call duration. If the anthropic package auto-detection worked, the span will be labeled with the model name and categorized under the AI Agents view.
From here, the Anthropic SDK’s built-in async support, streaming, and tool-calling features all work inside the same Sentry transaction context. Add tools, add agents, add multi-turn conversation tracking with gen_ai.conversation.id, and Sentry builds the trace hierarchy automatically.
The cost monitoring side (Sentry’s AI monitoring dashboard now shows per-model cost totals as of April 2026) is worth watching as usage grows. Sentry recommends tracking per-user and per-tier attribution alongside total costs to make informed decisions about rate limiting, pricing, and model routing. That data is in the same dashboard.